Stripe Terminal TCO Calculator 2026
A single misconfigured Terminal deployment can add thousands in annual fees and weeks of reconciliation work. The Stripe Terminal TCO calculator 2026 is a downloadable template that estimates total cost, compares regions and hardware options, and produces stakeholder-ready reports. This templates-downloads guide shows how to populate the calculator with processing rates, device leases, support contracts, and local taxes so finance teams can compare scenarios quickly. RouteReceipts integrates directly into Stripe and provides a dashboard-native allowlist, a decision audit log, and a Stripe Marketplace install that avoids custom webhook coding; its free plan includes 20 receipts per month for small pilots. See the Stripe Terminal Pricing & TCO hub and RouteReceipts Stripe setup to learn which region and hardware mix minimizes five-year costs?
What does the Stripe Terminal TCO calculator template include and who should use it?
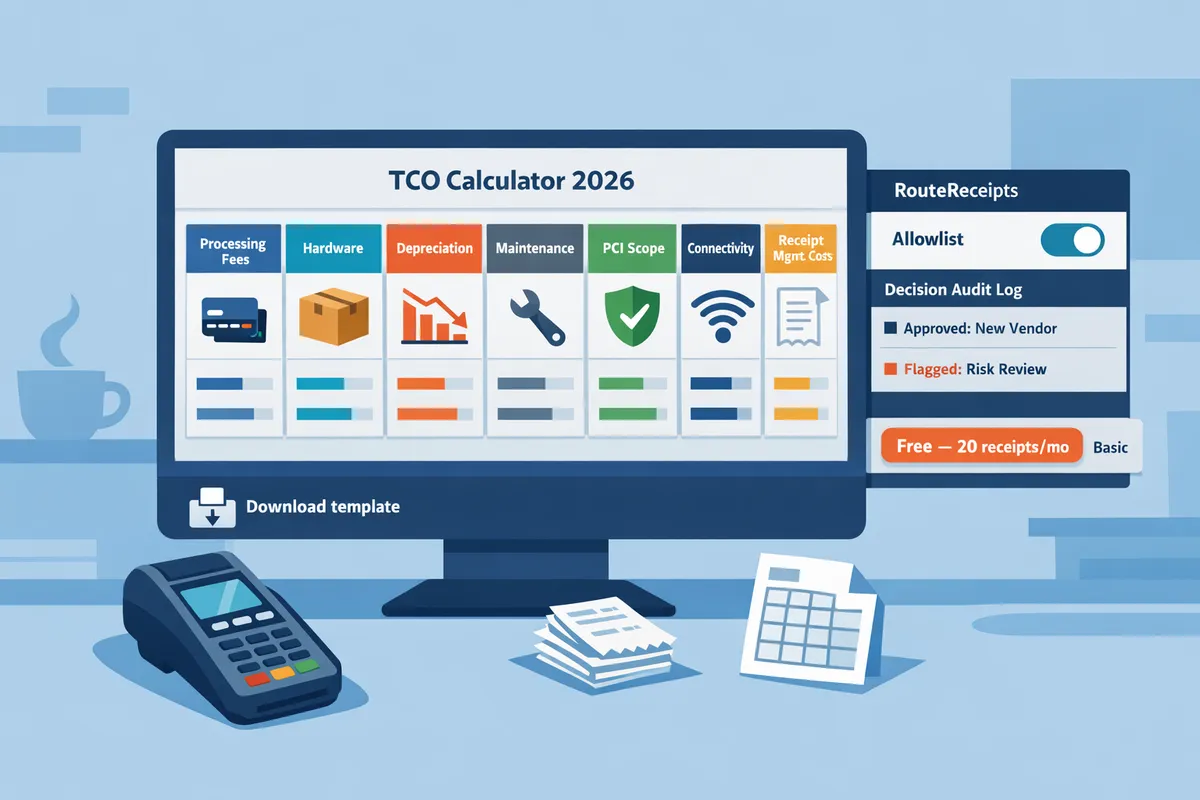
This template models total cost of ownership across processing fees, hardware amortization, maintenance, PCI/compliance, connectivity, and receipt-management, and it targets small shops, multi-location retailers, and agencies evaluating Stripe Terminal adoption. The worksheet produces a one-page stakeholder TCO and includes scenario presets for single-location and multi-location rollouts. Use the downloadable .xlsx or CSV to compare regions (US vs EU UK 2026), hardware options, and receipt-management savings from Route Receipts.
What is 'total cost of ownership' in this template?
Total cost of ownership is a financial model that sums transaction fees, hardware amortization, maintenance, compliance, connectivity, and receipt-management to show the true cost per payment. The template breaks TCO into clear buckets so teams can audit or override each assumption. Cost buckets in the worksheet:
- Processing fees. Per-transaction Stripe rates by region (select US, EU, or UK presets).
- Hardware amortization. Purchase cost divided by expected useful life (straight-line default).
- Maintenance and service contracts. Annual support or repair plans entered as recurring charges.
- PCI and compliance scope. Costs to maintain reduced PCI scope or third-party assessments.
- Connectivity. Cellular, Wi-Fi, or Ethernet costs per terminal, billed monthly.
- Receipt-management. Support and compliance overhead reduced by selective receipt routing.
Glossary (quick reference):
- PCI scope is the level of card-data compliance the business must maintain; smaller scope usually lowers audit costs.
- Amortization method is the way hardware cost spreads across years; the template uses straight-line by default and lets you switch to accelerated schedules.
- Recurring charges are monthly or annual fees such as connectivity, service contracts, or Route Receipts subscriptions.
Which inputs and outputs does the downloadable template provide?
The template requires monthly volume, average ticket, region, hardware model, expected useful life, connectivity type, service contracts, and training hours as inputs and outputs per-transaction cost, annual TCO, and a stakeholder-ready worksheet. Input fields include drop-downs for region (US, EU, UK), selectable terminal models (reader, countertop, POS), and preset amortization lengths. Output sections include:
- Per-transaction cost breakdown (processing + amortized hardware + support + connectivity + receipt-management).
- Annual TCO summary and three-year projection with depreciation schedules.
- Stakeholder one-pager that lists assumptions, sensitivity ranges, and recommended next steps.
Sample filled scenarios included in the download:
- Single-location retailer (example): Monthly volume $45,000, avg ticket $45, 1 countertop terminal, 3-year life, cellular plan $30/mo. The worksheet shows per-transaction hardware amortization of $0.08 and an annual TCO.
- Three-location rollout (example): Combined monthly volume $180,000, avg ticket $40, three countertop terminals, 5 backup readers, pooled connectivity, and a two-year rollout amortization schedule. The worksheet outputs consolidated per-transaction cost and a side-by-side location comparison.
You can export results as .xlsx for stakeholder reports or CSV for finance systems. The region presets let you compare Stripe Terminal total cost of ownership calculator US vs EU UK 2026 scenarios without manually changing fee tables.
How does Route Receipts integrate with the TCO calculator?
Route Receipts supplies receipt-routing metrics that the template converts into support-hour and compliance-cost savings line items. Our template accepts Route Receipts exports—allowlist usage, routed-receipt counts, and decision-audit entries—and maps them to reduced support contacts and lower compliance overhead. Steps to use Route Receipts data with the worksheet:
- Export routing metrics from Route Receipts. See the RouteReceipts Stripe setup documentation for export instructions and how routing decisions appear in the audit log.
- Map routed receipts to support contacts. For example, if 1,200 routed receipts per month correlate to 40 support contacts, enter average handling time (minutes) to calculate monthly support-hour savings.
- Convert support-hours to dollars. Multiply saved hours by average wage or outsourced support rate and place the result under receipt-management savings.
- Add compliance savings. Use the audit log counts to show reduced data exposures and lower third-party audit needs, then input conservative cost reductions into the compliance line item.
For more on product rationale and operational benefits, see Why Did We Build Route Receipts? and our beginner’s no-code guide to selective receipt delivery. If you need help exporting data or interpreting the audit log, contact our team via Support.
⚠️ Warning: Route Receipts accesses customer contact fields to route receipts; review the RouteReceipts privacy policy before exporting production data and use anonymized test accounts when possible.
How do you use the Stripe Terminal TCO calculator 2026 template step by step?
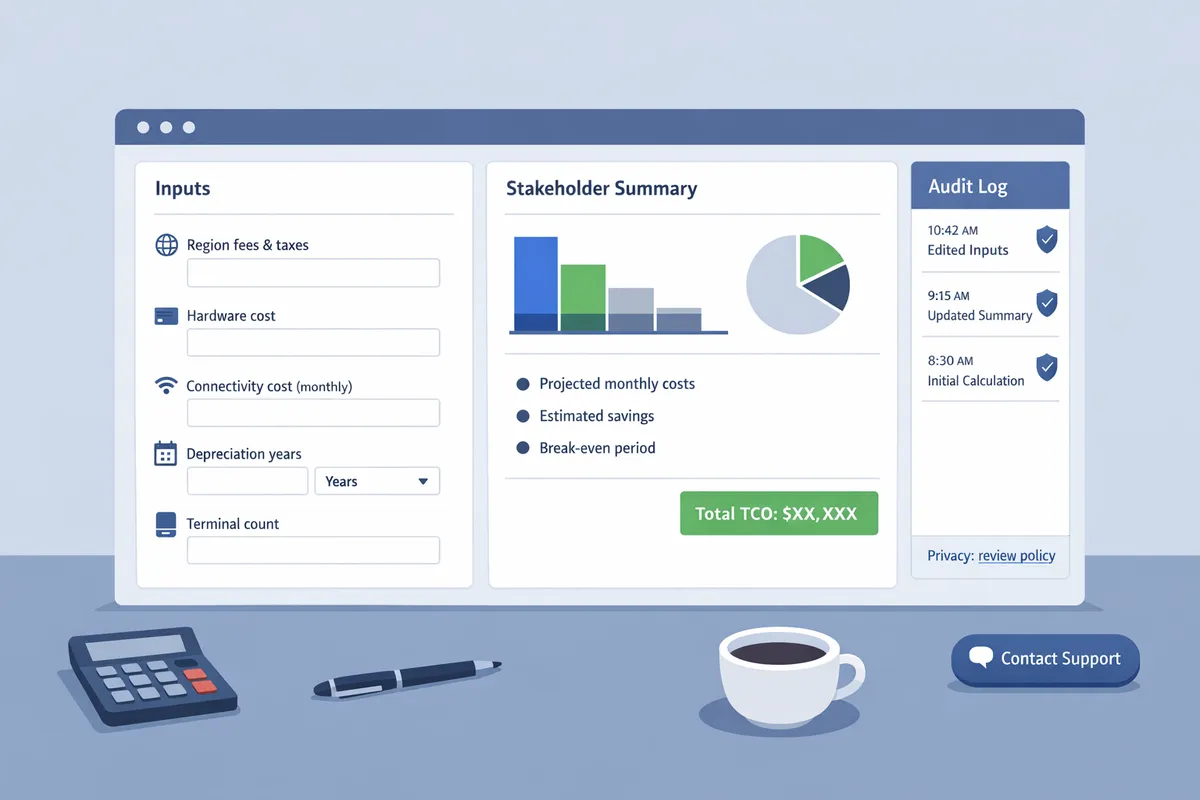
Use the Stripe Terminal TCO calculator template by following four sequential steps: enter regional fees and taxes, add hardware and connectivity costs, model depreciation and ongoing maintenance, and export scenario reports for stakeholders. This workflow helps you produce comparable per-transaction and annualized costs across US, EU, and UK markets. The template also includes built-in checks to catch common spreadsheet mistakes and a presentation worksheet you can export for finance and ops reviewers.
Step 1 — Enter regional processing fees and taxes 🧾
Enter base processing rates and regional tax modifiers so the sheet applies the correct fee profile per market. The template separates interchange plus card network fees from your platform margin and per-transaction fixed cents so you can compare true cost components. Example row (fill into the Fees block): interchange 1.30% + $0.05, card network fee 0.10%, platform margin 0.50% = total 1.90% + $0.05 (example inputs only). Toggle the card-present vs online switch so the calculator applies card-present fee profiles where relevant. The sheet includes country-specific VAT and US sales tax fields; set a tax type per region and the template will add taxes to gross receipts and to tax-sensitive inputs.
💡 Tip: Keep interchange and card network fees in separate columns to avoid double-counting when you apply platform margins.
Common mistakes this step catches: copying a single blended rate across markets, forgetting to mark card-present transactions, or applying tax to net instead of gross. Manual modeling of these inputs often causes inconsistent assumptions across locations and wastes budget review hours.
Step 2 — Add hardware and connectivity costs (S700 vs S710) 🔌
List each reader model, one-time price, expected useful life, and connectivity choice so the template amortizes hardware per transaction. Add distinct rows for S700 and S710 with the one-time hardware cost, then choose Wi‑Fi, dedicated cellular plan, or Ethernet for each unit. The template contains a toggle to compare S700 vs S710 cellular plans in the dedicated cellular block and converts monthly SIM fees into per-transaction impact.
| Connectivity option | Example monthly cost (illustrative) | How the template shows it |
|---|---|---|
| Wi‑Fi | $0 | No recurring connectivity cost; per-transaction impact from device amortization only |
| Dedicated cellular | $10 | Template adds monthly SIM cost to Opex and divides by monthly transactions for per-transaction impact |
| Ethernet | $0–$20 (ISP) | Treated like Wi‑Fi but flags higher installation cost if present |
Example use: add reader cost $350, useful life 3 years, monthly cellular $12. The sheet amortizes the $350 and adds monthly cellular across projected transactions to report per-transaction hardware impact. Wrong depreciation periods or omitted SIM plans understate total cost and produce misleading payback timelines.
Step 3 — Model depreciation, maintenance, and ongoing fees ⚙️
Set useful life, annual maintenance, warranty extension, PCI/compliance, and receipt-management costs so the calculator reports annualized and per-transaction figures. The template computes annual depreciation from one-time cost and residual value, adds recurring warranty or maintenance contracts, and lets you add PCI ASV scan fees or assessor costs as annual line items. Include receipt-management as an Opex line: either staff time to reconcile receipts or the cost of a receipt routing tool.
RouteReceipts is an app that selectively sends Stripe receipts to an allowlist so finance teams avoid manual cleanup and reduce receipt-related admin time. If your business uses selective routing, enter your RouteReceipts plan cost in the receipt-management block so the model quantifies its impact on net cost and on auditability. For setup guidance, see our Documentation on integrating receipt routing.
⚠️ Warning: Omitting PCI or receipt-management costs creates audit gaps and often doubles reconciliation time during reviews.
This step includes spreadsheet checks for negative depreciation, duplicate recurring lines, and missing region tags so you avoid common modeling errors that lead to underbudgeting.
Step 4 — Produce scenario worksheets and stakeholder-ready reports 📊
Use the template's scenario export to generate PDF and CSV reports that show assumptions, net revenue, per-transaction cost, and payback period for each scenario. The template includes a pre-built "presentation worksheet" that pulls summary rows, charts (per-transaction cost breakdown, payback curve), and a assumptions table designed for finance and operations leaders who do not open raw tabs. Export steps:
- Select scenario presets (baseline, high-volume, multi-location).
- Click Export PDF to produce a formatted report with charts and the assumptions appendix.
- Download CSV for system ingestion or detailed drill-down.
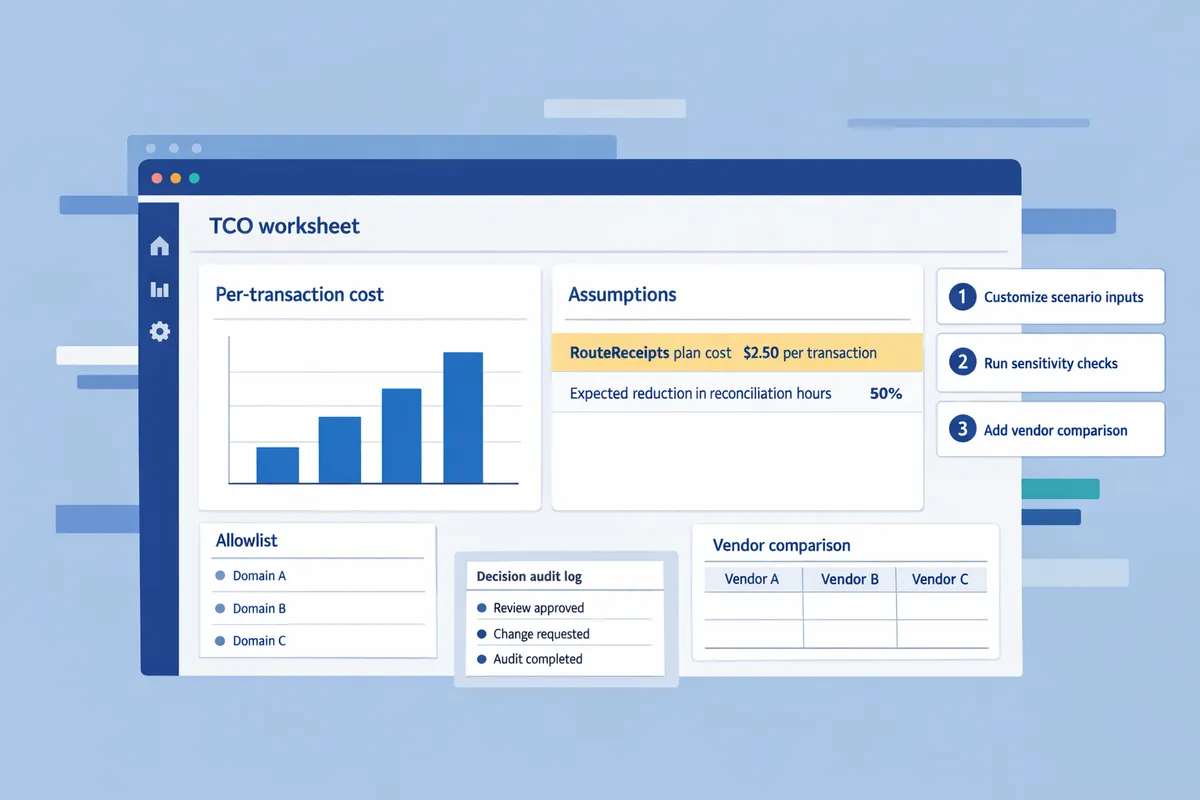
Example scenario: a three-location retailer with 10,000 monthly transactions can toggle S700 vs S710, Wi‑Fi vs cellular, and see payback on hardware within the presentation worksheet. To explain receipt-management benefits in stakeholder decks, link the assumptions row that shows RouteReceipts plan cost and expected reduction in reconciliation hours. For more background on selective receipt delivery and why teams adopt it, see Why Did We Build Route Receipts? and the beginner's guide in our blog.
How can you customize the TCO template for real-world scenarios and vendor comparisons?
Customize the TCO template by editing scenario inputs, running sensitivity checks, and adding a vendor comparison table to produce board-ready 1–3 year TCO reports. Our website's worksheet includes preset scenarios, a vendor table view, and a notes tab so procurement and finance can audit every assumption. Use the downloadable board worksheet to export a one-page TCO summary and an attached notes tab for approvals.
💡 Tip: Record every assumption (currency, amortization period, ticket-size source) in the template's Notes tab before sharing with procurement to avoid rework.
How do I model three ROI scenarios: small shop, multi-location, and high-volume? 🧾
Model three ROI scenarios by cloning the template presets and changing transactions per month, average ticket, and number of locations for each scenario. Start with three distinct presets: Small shop (1 location), Multi-location retailer (3–10 locations), and High-volume (20+ locations); each preset should auto-populate the amortized hardware cost, monthly connectivity, and estimated PCI workload.
Step-by-step example inputs (use these as examples you can edit):
- Small shop (example): 1 location, 1,000 transactions/month, $25 average ticket, assumed processing cost 2.9% + $0.30 per transaction, one S700 terminal at $599, $15 monthly cellular. The template computes annual processing cost, amortized hardware (3-year), connectivity, and maintenance to produce a 3-year TCO and payback period.
- Multi-location (example): 5 locations, 10,000 transactions/month, $40 average ticket, one terminal per location, cellular plan per reader, and a modest service contract. The template aggregates location-level costs and shows net margin impact by subtracting TCO from gross revenue assumptions.
- High-volume (example): 20 locations, 100,000 transactions/month, $30 average ticket, negotiated interchange or volume pricing input, and centralized maintenance line items.
Run sensitivity checks by changing two inputs at once: increase average ticket by 5% and lower decline rate by 0.5% to see how payback shortens. Our website's template shows the delta on payback period and annual savings so you can present a best/worst case to the board.
How should I build a vendor comparison table (Stripe Terminal vs alternatives)? 📊
Build a vendor comparison table by listing hardware model, one-time cost, monthly connectivity, estimated PCI workload, maintenance, and calculated 1–3 year TCO for each vendor. A side-by-side table lets procurement score options objectively across cost, operational effort, and compliance impact.
| Vendor | Hardware model (example) | One-time cost (example) | Monthly connectivity | Estimated PCI workload (hours/year) | Annual maintenance/contract (example) | 3‑year TCO (calculated) |
|---|---|---|---|---|---|---|
| Stripe Terminal | S700 / S710 | $599 / $799 | $15 / $25 per reader | 20 (low) | $300 | Template computes total |
| Competitor A | Square Reader / POS | $49 / $499 | $10 / $20 | 30 (medium) | $350 | Template computes total |
| Competitor B | Verifone P400 | $899 | $20 per terminal | 40 (high) | $900 | Template computes total |
Use procurement scoring to compare options quantitatively. Suggested weightings: processing fees 40%, hardware & amortization 25%, PCI scope 20%, maintenance/support 15%. Enter scores (1–5) in the template and let the worksheet calculate a weighted rank. Adjust weights to reflect your business priorities (for example, put more weight on PCI scope for enterprise customers).
Account for regional differences (Stripe Terminal total cost of ownership calculator US vs EU UK 2026) by adding a region multiplier for taxes, cellular plan pricing, and VAT. For example, change connectivity pricing and VAT rates by region and re-run the 3-year TCO to compare US vs EU vs UK outcomes.
How do I add receipt-management savings using Route Receipts metrics? ✉️
Add receipt-management savings by mapping Route Receipts allowlist and audit-log usage into reduced support hours and lower email volume in the worksheet. The template includes a Receipt Savings sheet where you enter receipts/month, percent avoided manual requests, average support time per request, and support hourly rate; it outputs monthly and annual savings.
Template mapping (fields to fill):
- Receipts processed per month. Example: 5,000.
- Percentage of receipts that no longer generate manual requests due to allowlist rules. Example: 60%.
- Average support time saved per prevented request. Example: 15 minutes.
- Average support hourly cost. Example: $30/hour.
Example calculation (illustrative): 5,000 receipts × 60% avoided = 3,000 prevented manual requests. At 0.25 hours saved per request and $30/hour, monthly savings = 3,000 × 0.25 × $30 = $22,500. Enter Route Receipts subscription fee on the pricing line to calculate net savings.
Route Receipts offers a free plan that includes 20 receipts per month and paid tiers for higher volume; enter your expected plan cost in the template to calculate net ROI. For implementation steps, refer to our Documentation for setup and allowlist configuration and consult the Route Receipts Terms of Service for account and billing terms. For background on why selective routing matters and how it reduces inbox clutter and finance work, see Why Did We Build Route Receipts? and our no-code guide to selective delivery.
Download the Stripe Terminal TCO calculator 2026 to estimate hardware and regional costs.
Use the TCO template to build stakeholder-ready reports that compare S700 and S710 hardware, cellular plan pricing, and US vs EU vs UK scenarios side-by-side. The spreadsheet helps finance teams quantify upfront hardware, ongoing cellular fees, and per-transaction costs so you can justify procurement decisions quickly. RouteReceipts is a specialized application designed to enhance the way businesses manage their Stripe receipt distribution. This app addresses a significant limitation within Stripe's native functionality, which traditionally forces businesses to either send receipts to all customers or none at all. Integrating selective receipt routing with your TCO outputs reduces post-sale support and prevents irrelevant receipts from reaching enterprise partners. For setup details, follow our RouteReceipts Stripe setup guide in the Documentation. For background on why selective routing matters, see Why Did We Build Route Receipts, and if you need help, contact Support. Download the Stripe Terminal TCO calculator 2026 template now to produce a polished, region-aware cost comparison for stakeholders.